
 Define Bentley® Profile
We have updated the SofTrack Console to have a more familiar look and feel to applications such as Microsoft® Office.
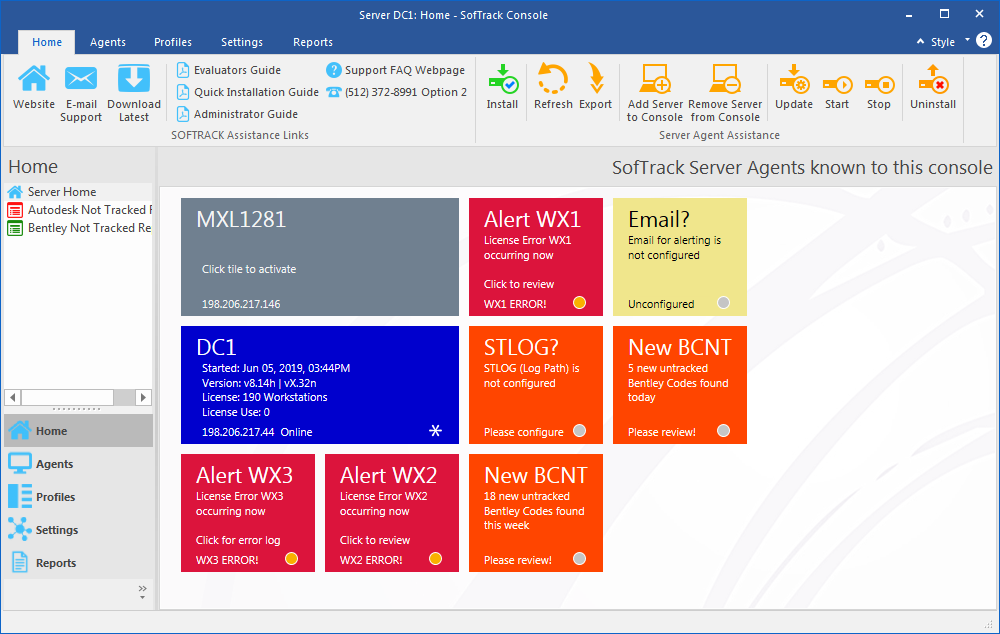
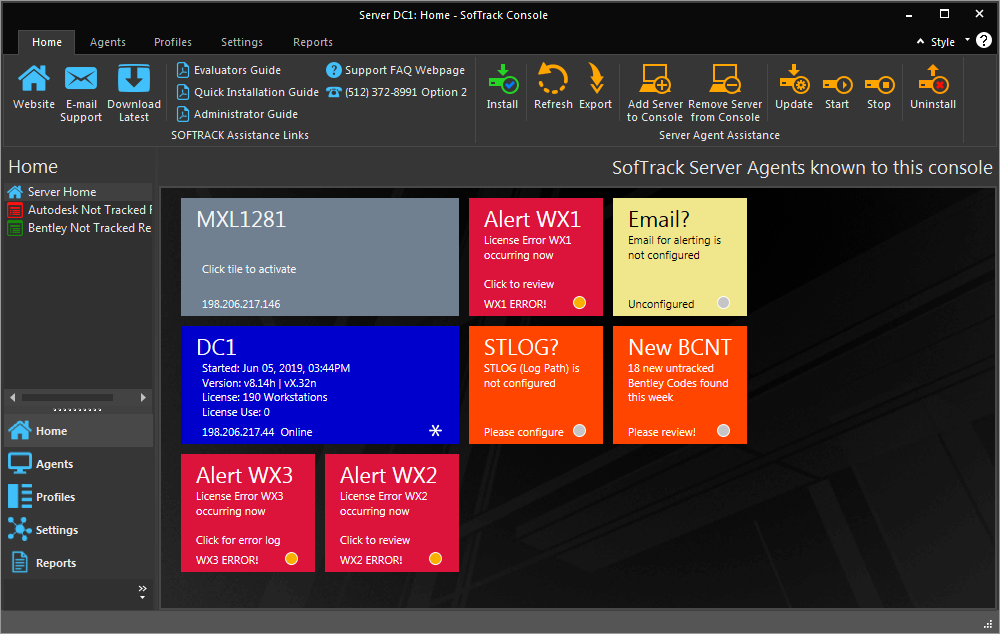
The following 3 images are of the same interface, each with a different style (also called themes). The style can be set at the top right corner with the dropdown Style menu item.
Default Style, Office 2016 Colorful
Optional Style, Office 2016 Dark
Optional Style, Office 2013 White
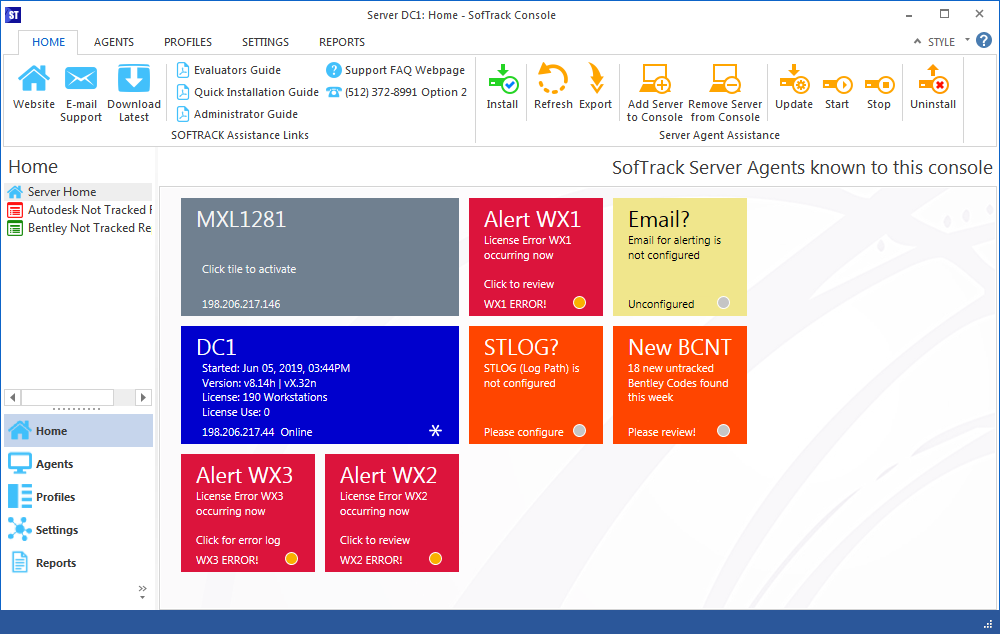
There are many other styles/themes to choose from and we will add new themes in the future.
When setting the style it is remembered each time you open the SofTrack Console. Also, each time you open the SofTrack Console it will automatically open to the last view shown prior to being closed.
Both these new abilities are only remembered per user+workstation. Thus, if you use the SofTrack Console from another workstation or as logged in as a different user the defaults will be used.
Additionally, the SofTrack Console window (and most of its sub-windows) can be re-sized as required, previously only some report windows could be re-sized and the items be shown correctly adjusted for the new size.
The server tile will be blue (as shown above, gray is used when the server tile is not selected) if the server has been added to the SofTrack Console (servers added is specific to your workstation and logon, this allows each Administrator to have their own set of defaults). However, if you find the tile as being green:
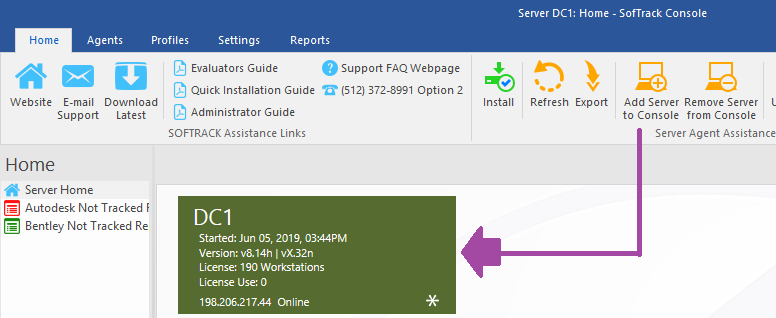
this specifically indicates the server was automatically shown because no servers have yet been added to the console and that server (or workstation) is the current machine.
As shown above, there are now several Alert Tiles that can occur.
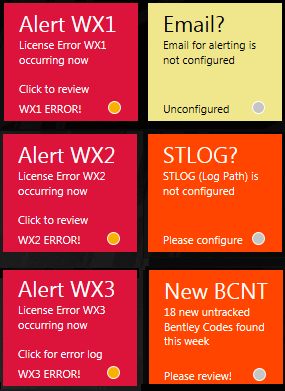
These tiles are shown on the 'Server Home' page section of the Home tab. If you click on an alert tile, the console will change the view to section of the console related to the issued being alerted.
There is another tile not shown above, it has a blue background and will alert you that your SofTrack Token (i.e. SofTrack License) will expire in the next month or less and clicking that tile will start an email within your default email client.
The Agents tab now has (3) sections.
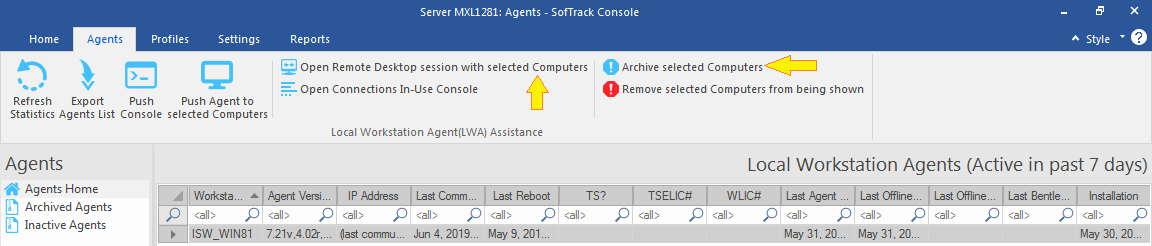
The first is the Agents Home, this section shows only those workstation agents active in the past 7 days.
The second is the Archived Agents section. This section shows that workstation agents that you have removed from the other two views. It is presumed these agents are no longer being used but may be again in the future.
The third section is the Inactive Agents section. This section shows workstation agents that were last active more than 7 days ago.
In addition to the new views above there are three new buttons:
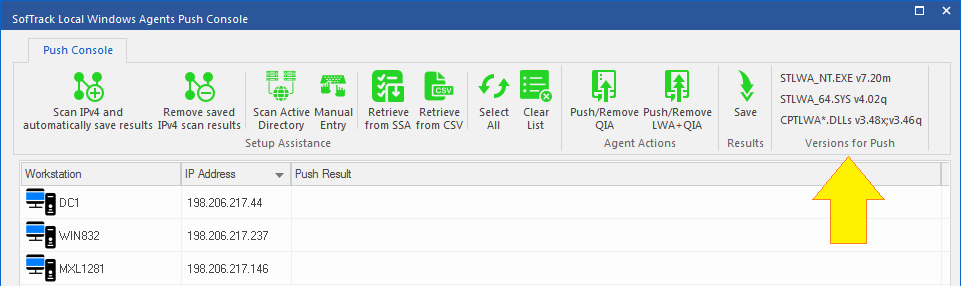
SofTrack's Push Console had many features that were only avaiable via right-click menu and as a result may not have been immediately obvious. The revised Push Console now utilizes a menu ribbon (as shown below). And, notice at the right side the workstation agent versions to be pushed are shown. These values are obtained directly from the agent files that will be pushed.
The Profiles tab includes two new views:
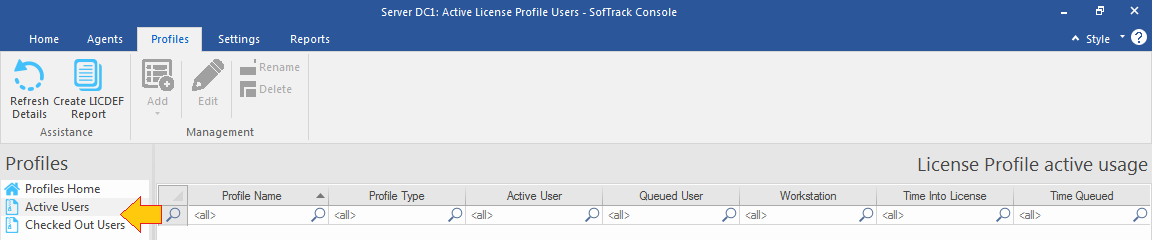
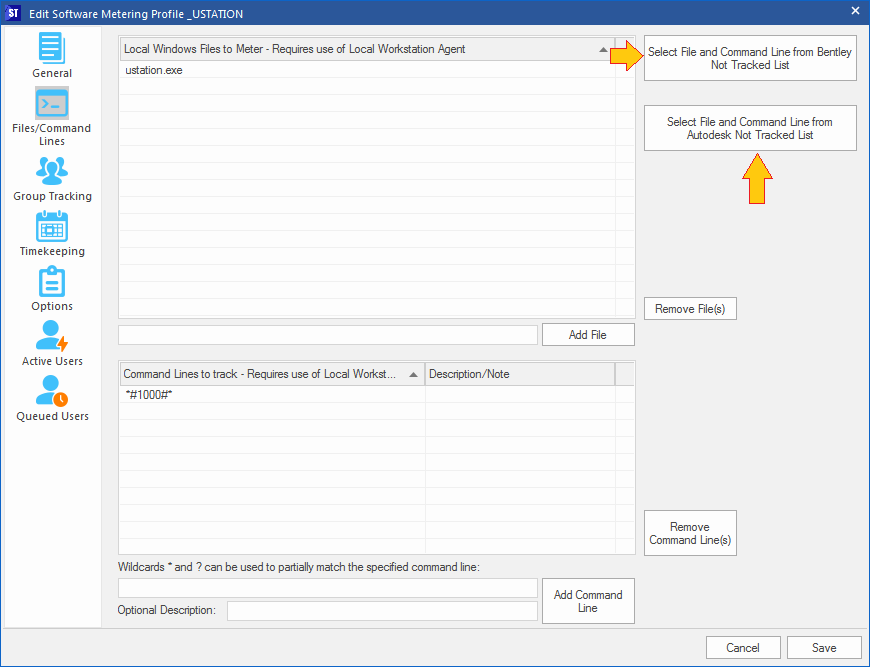
When creating and maintaining License Profiles for control of Bentley® and Autodesk® licenses you can now directly add new not yet tracked codes directly when editing the profile:
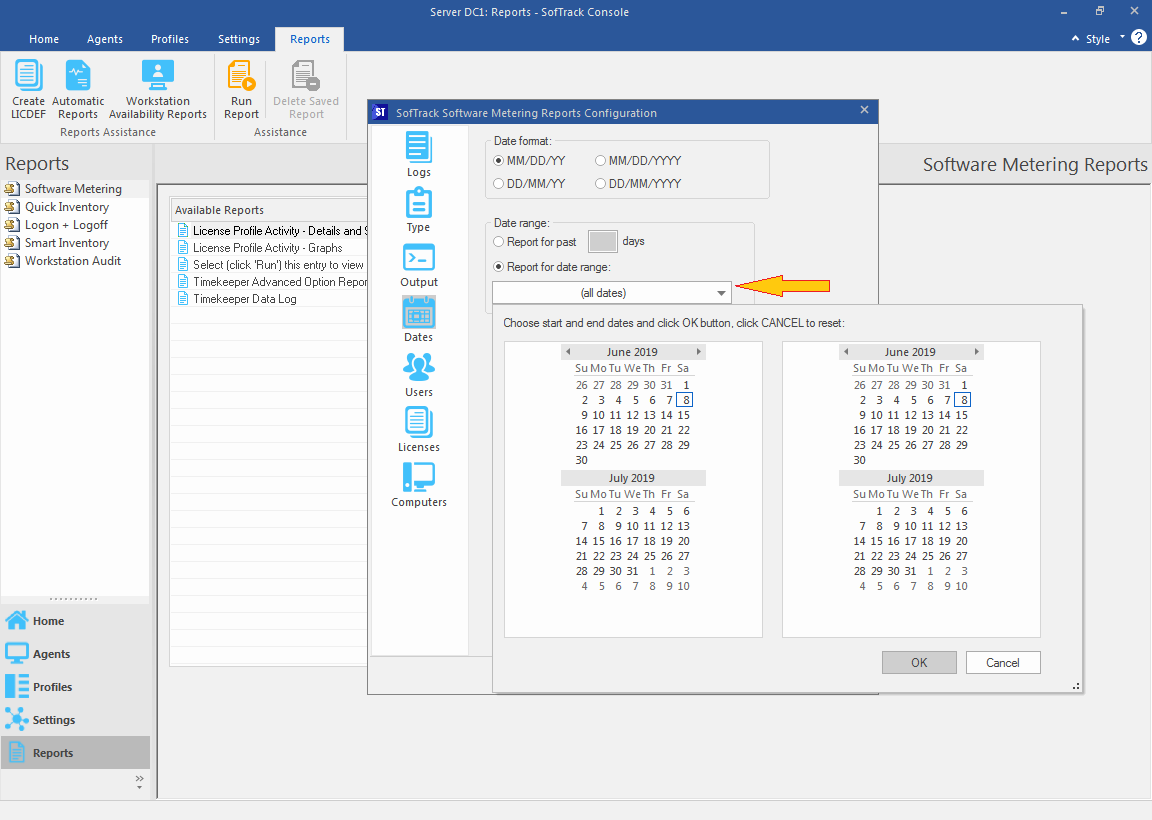
We have made several incremental updates to configuration, viewing and saving of Software Metering Reports.
The first is selection of the date range with a new method:
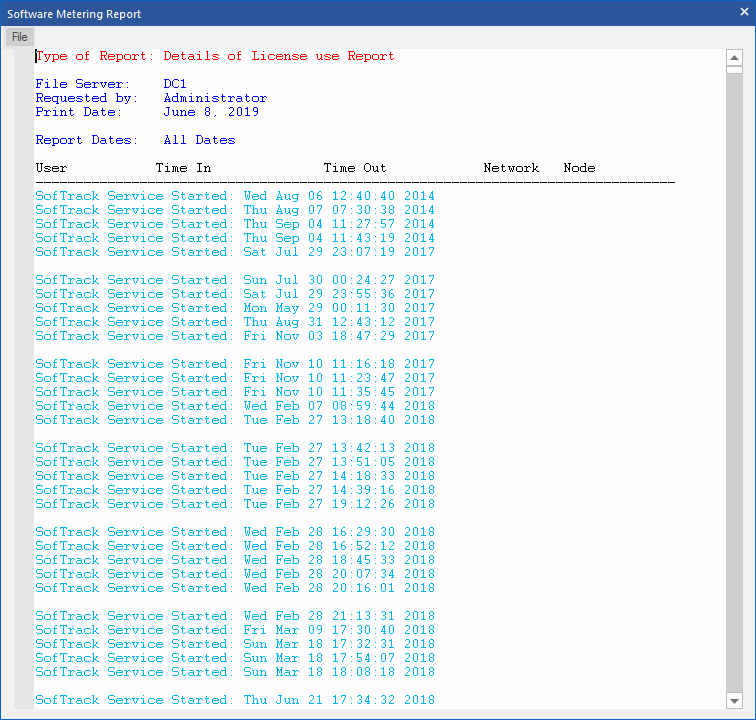
The second update is to the report viewer, it has been updated to be fully functional including vertical scrolling with the mouse wheel:
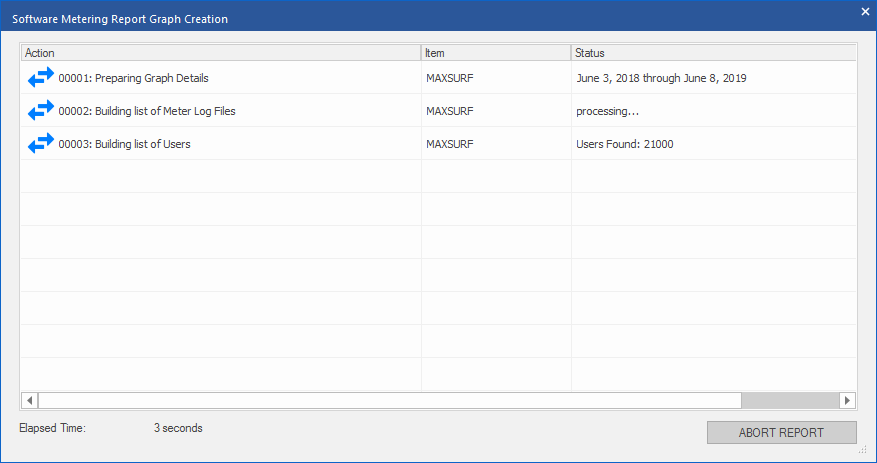
While a report is being built there is a new progress window that includes elapsed time and an Abort button:
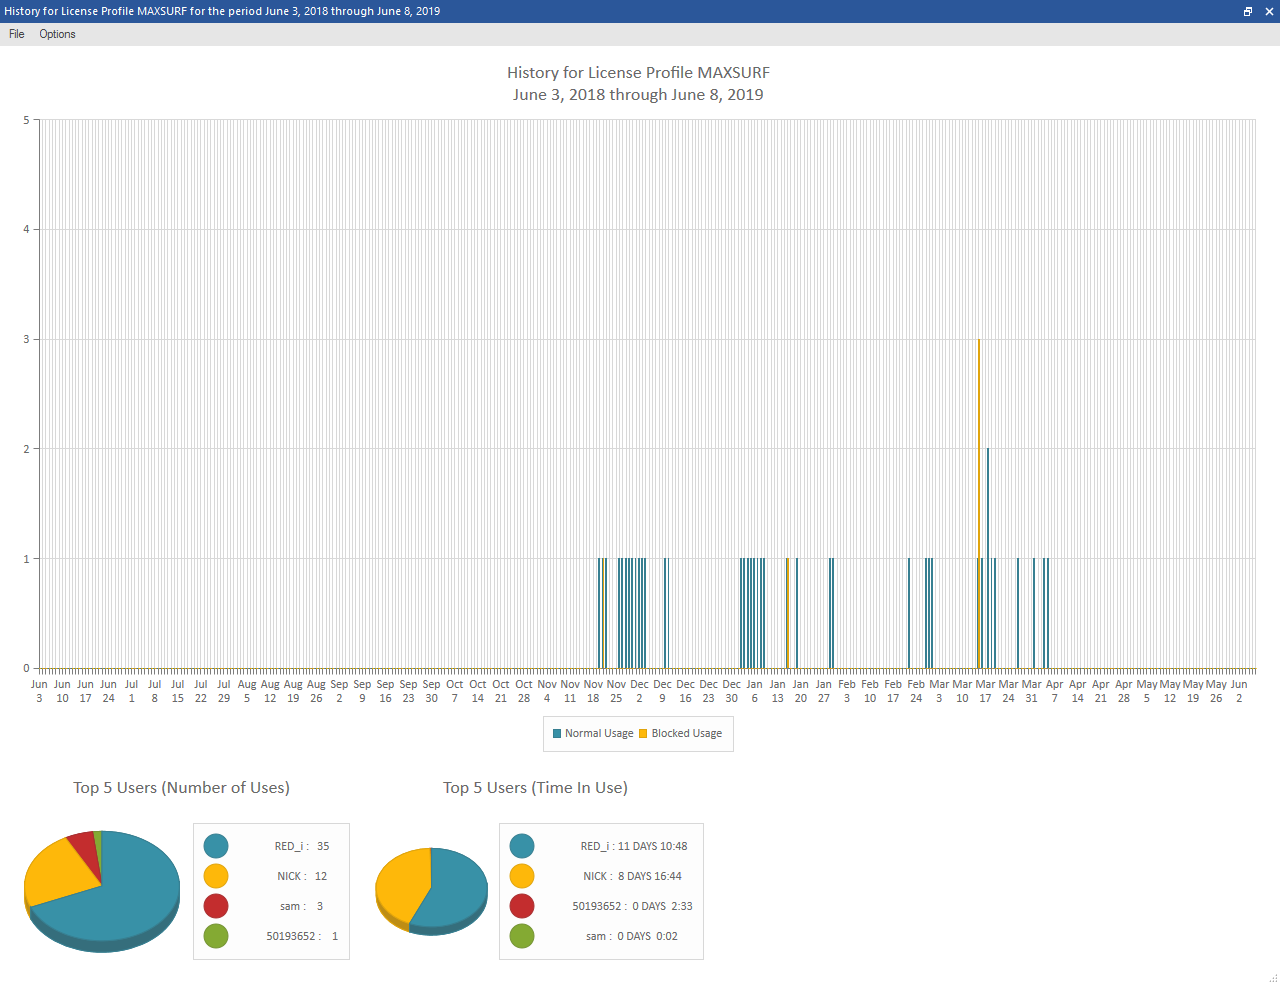
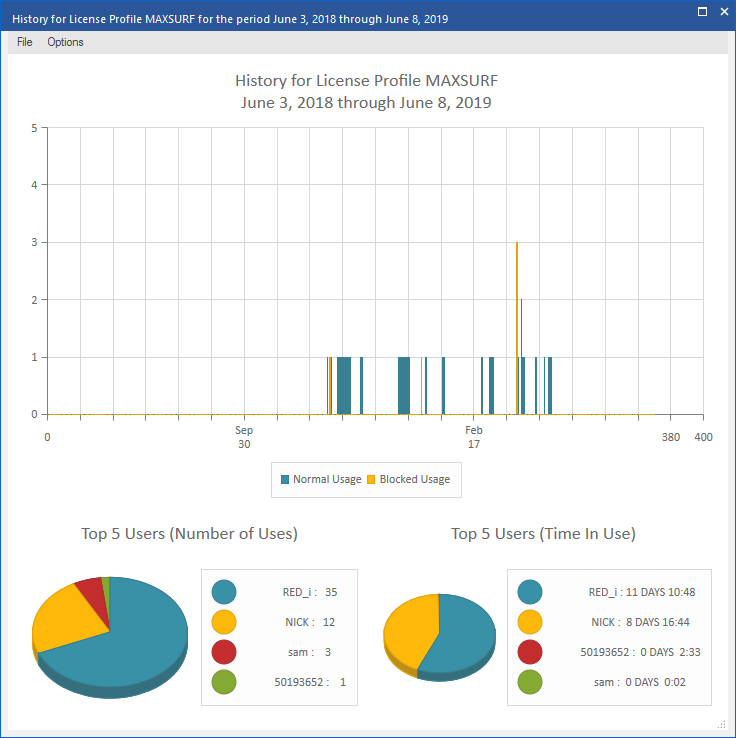
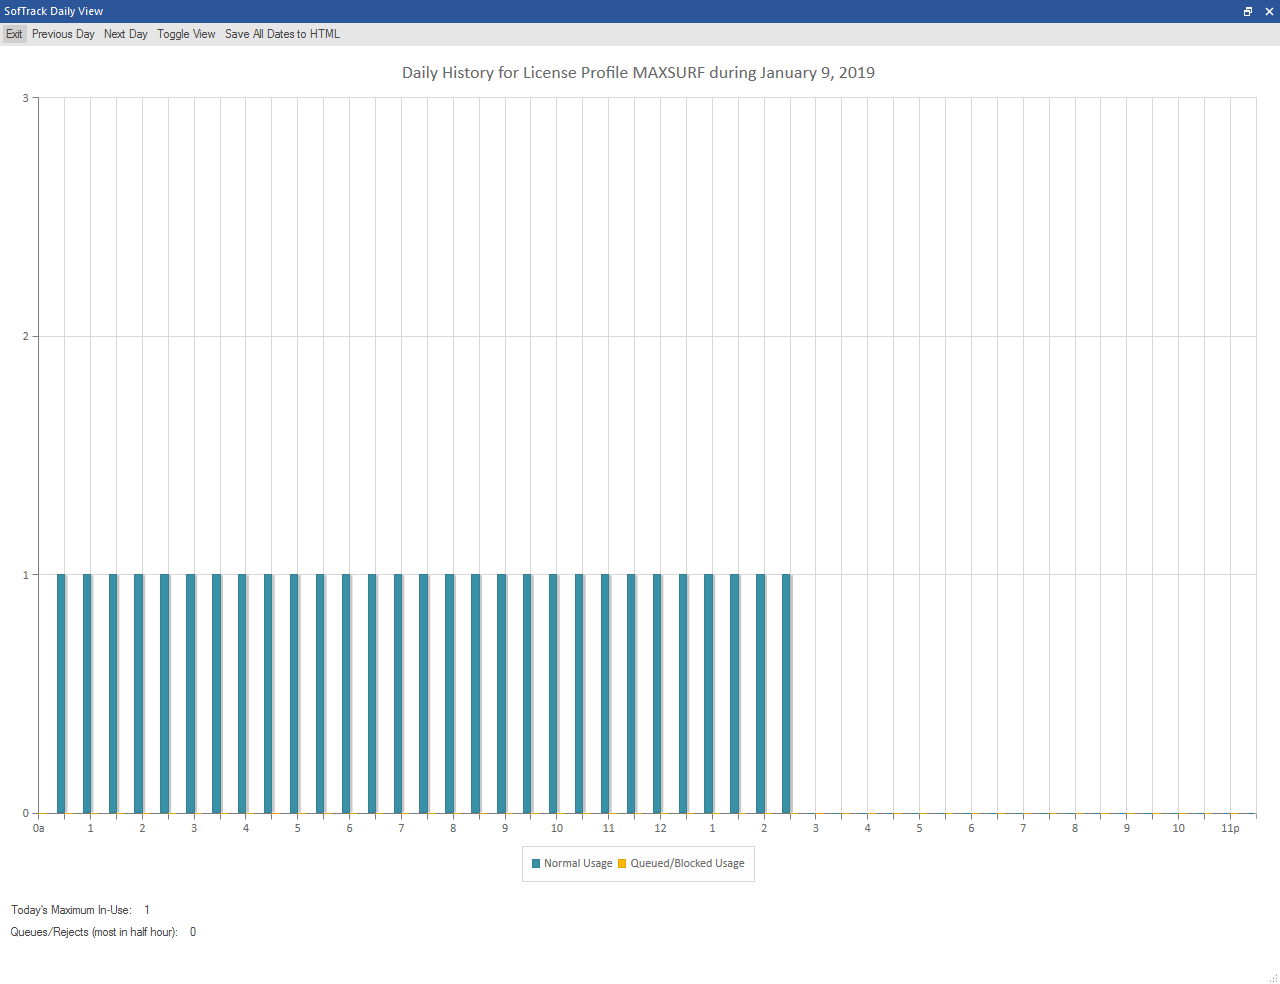
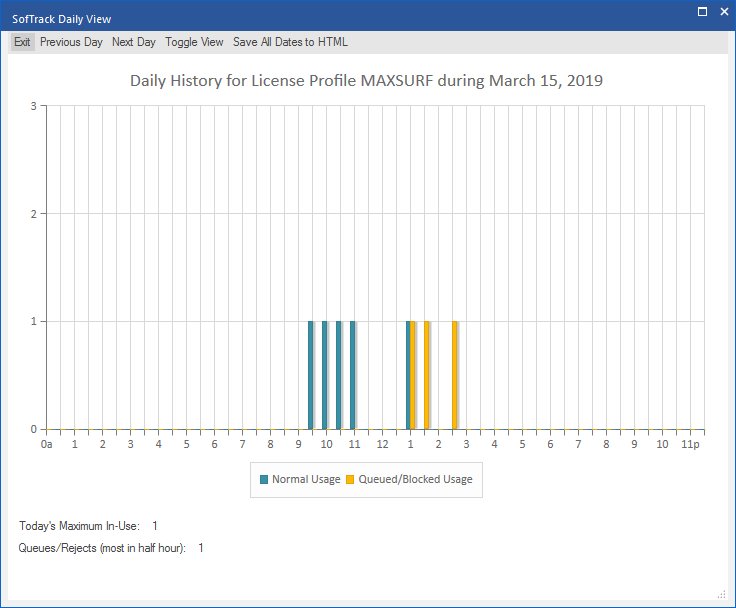
The History Graph has been updated with the following:
The workstation audit view has been revised:
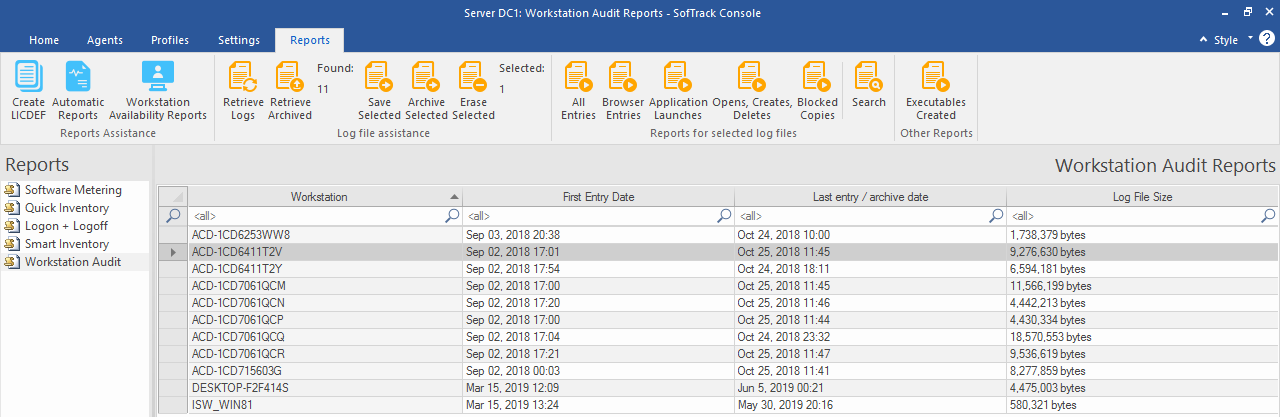
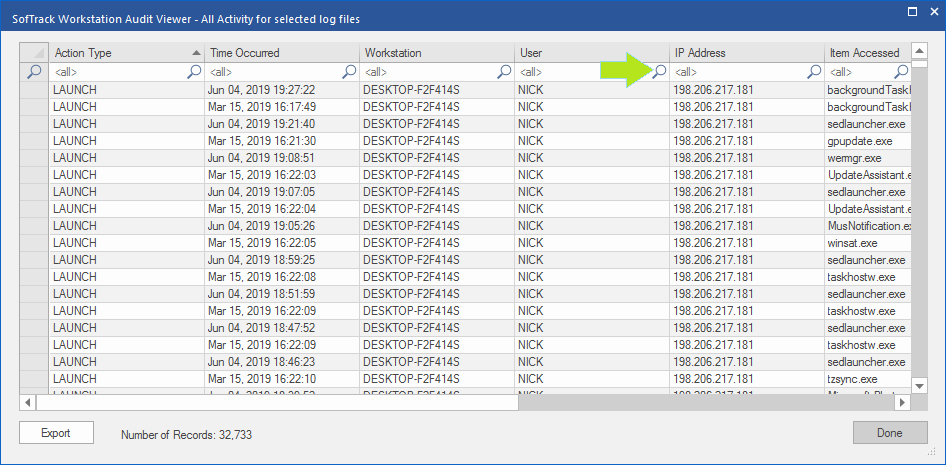
The workstation audit reports now include a searchable grid view:
If you have a support issue, please initiate your request via any of these methods:

SofTrack > Simplifying IT Asset Management
©1987:2021 Integrity Software, Inc. | Contact